


Automated recognition and correction of warp
Additive manufacturing (AM), particularly material extrusion, offers immense flexibility and customisation, making it the most common AM technology due to its ease of use, low cost, and versatility with different materials. However, this process is prone to warping, a common issue where objects deform as they cool down due to residual thermal stresses from uneven cooling. Warping errors are irreversible and significantly impact the shape and quality of manufactured objects. These errors are challenging to detect and correct because they develop gradually and are temporally separated from their cause. To address this, we have developed an AI-based system that detects and corrects warp in real-time, enhancing the reliability and efficiency of the 3D printing process.
Warping occurs during the cooling phase of 3D printing when different parts of the object contract unevenly, leading to deformation. This issue often goes unnoticed until significant warping has already compromised the print, making recovery difficult or impossible. Traditionally, operators have relied on trial and error to adjust machine settings and part geometry, but this method is time-consuming, inefficient for large-scale projects, and impractical for operations involving multiple machines. Automated solutions are essential to ensure consistent print quality and scalability.
Building a comprehensive warp detection dataset
Our solution begins with a robust dataset of 3D-printed parts, specifically curated to include examples of warp. The dataset contains over 10,000 images, with approximately 1,400 of these featuring warped areas. Each instance of warp was annotated with bounding boxes, resulting in nearly 2,000 labelled regions. This dataset provides the foundation for training our AI model to recognise and evaluate warp in manufactured objects.
AI model for warp detection and severity estimation
To efficiently train the YOLOv3 model for warp detection, we utilised transfer learning. The model was initialised with pre-trained weights from the COCO dataset, a large-scale image dataset, allowing it to leverage pre-learned features like edges and corners. This approach enabled the model to generalise effectively across different printing conditions without freezing any layers during training. Data augmentation techniques were applied to the warp dataset to prevent overfitting, simulating various lighting conditions, camera angles, and object geometries. This robust training process resulted in a model capable of detecting warping with high accuracy across diverse conditions.
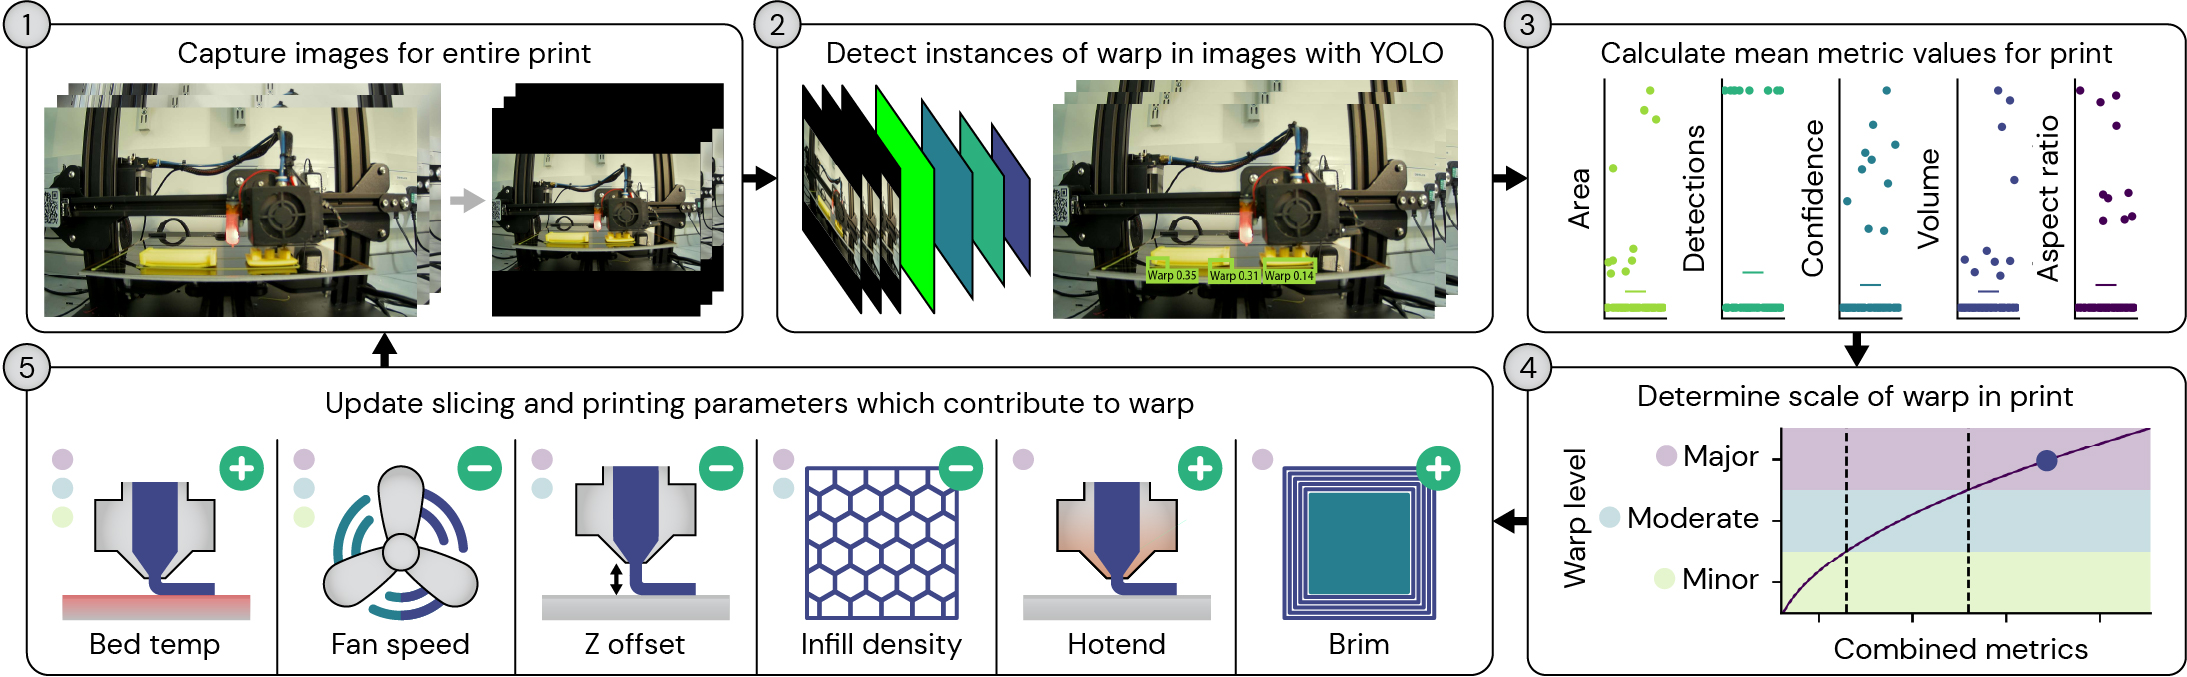
Beyond detecting warp, it was crucial to quantify its severity to effectively correct it. We developed five metrics—bounding box area, number of detections, prediction confidence, estimated warped volume, and aspect ratio of the warped region—to assess the severity of warping during and after a print. These metrics were calibrated using controlled experiments with different bed temperatures, known to influence warp severity. By mapping these metrics to continuous values using linear ridge regression, we created a system that can predict warp severity in real-time and adjust printing parameters accordingly to minimise or prevent further deformation.
Slowing the development of warp during manufacturing
To improve how machines handle warping during manufacturing, we attempt to adjust certain settings on-the-fly. If the warping is minor, it can be slowed down, potentially allowing the part to be salvaged.
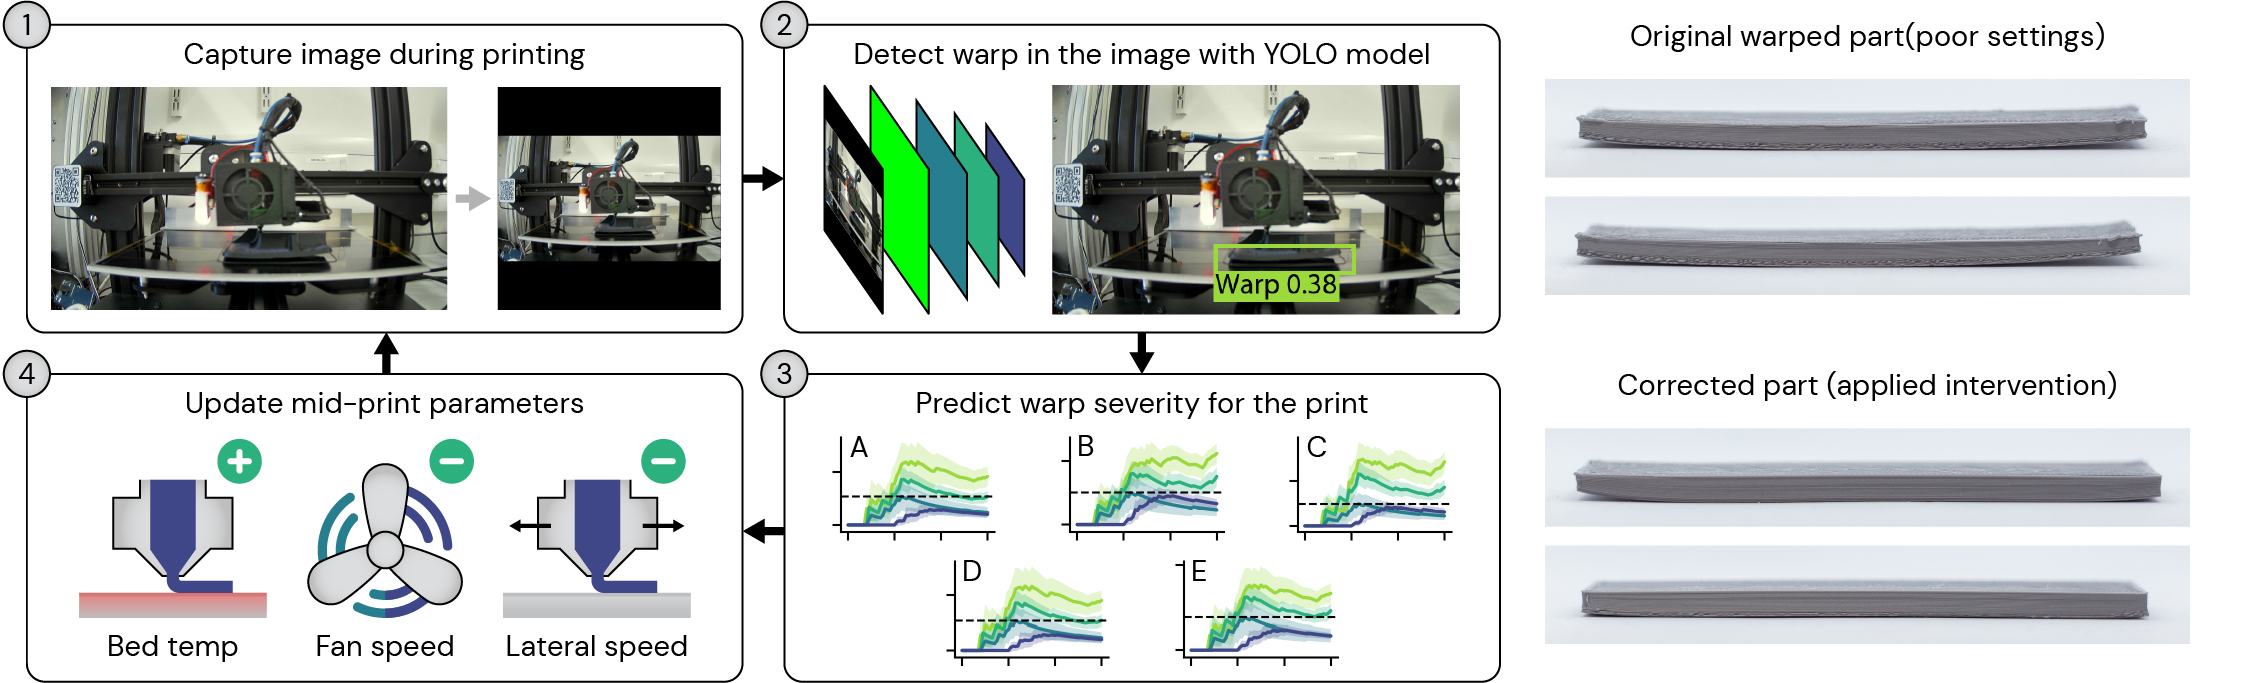
The system captures images of the object every 30 seconds and transmits them to a computer. The computer then utilises our AI model to detect any warping in the images and calculate our warping metrics. These metrics are compared against pre-established limits, derived from our previous experiments, which indicate the severity of the warping. If any of our metrics suggest significant warping, the server sends a command to the printer to adjust specific settings. These settings include the temperature of the base plate, the speed of the printer, and the operation of the fan used to cool the object. We have found that modifying these settings can substantially reduce warping during the manufacturing process and even prevent a part from detaching from the print bed.
Feed-forward correction
If the warping is excessive and the print cannot be salvaged, it is likely best to scrap the print and start again. Our AI model and warping metrics are also capable of adjusting settings before the next iteration of the object is printed, preventing warping from occurring altogether. Similar to how the system attempts to save a print, the server sends a message to the printer to modify additional settings for the subsequent print. These settings include: the temperature of the base plate, the speed of the printer, the fan used to cool the object, the material density within the object, the distance between the nozzle and the base plate, the width of the base layer, and the temperature of the nozzle for the first layer. Overall, this feedforward correction system can help save time, money, and materials, while also producing stronger parts by using more material without inducing warping.
Fixing thermal deformation issues across manufacturing
Thermal deformation is a pervasive challenge across various manufacturing processes, not just in 3D printing. Our AI-driven approach to warp detection and correction offers a promising solution that can be adapted to other forms of additive and subtractive manufacturing. By extending our methodology, which integrates real-time monitoring, data-driven prediction, and dynamic adjustment of process parameters, manufacturers can address thermal deformation issues more effectively. This approach not only enhances the quality and consistency of manufactured parts but also reduces waste and improves overall production efficiency, making it a valuable tool across multiple industries.
Further Reading
Read the paper
Authors
Douglas A. J. Brion
Sebastian W. Pattinson
